Fleet based fishing: fishing selectivity and fishing mortality curve
Jaideep Joshi
28 October 2024
fishability_selectivity.Rmd
params_file = here::here("params/cod_params.ini")
params_file_fleet = here::here("params/fleet_1_params.ini")
Initialize a population
To simulate a fished population, we start with creating a fish and constructing a population from it, as usual.
fish = new(Fish, params_file)

pop = new(Stock, fish)
pop$readParams(params_file, F)
## [1] 0
pop$superfish_size = 2e6 # Each superfish contains so many fishPerform Spinup
For simulating fishing, it is important for the population to start with a realistic state distribution. Therfore, we “spin-up” the population under no-fishing conditions.
v = pop$equilibriate_without_fishing(5.61) |> matrix(nrow=200, byrow=T) |> as.data.frame() |> setNames(c("ssb", "tsb", "maturity", "nr", "dr", "nfish"))Let’s see how the population state looks after no-fishing equilibrium.
d = pop$get_state()
dist = table(d$age, d$length)

par(mfrow = c(5,1), mar=c(5,5,1,1), oma=c(1,1,1,1), cex.lab=1.5, cex.axis=1.5)
plot(v$nfish~seq(1,200,1), ylab="No. of superfish", xlab="Year", type="l", col=c("cyan3"))
plot(v$maturity~seq(1,200,1), ylab="Maturity", xlab="Year", type="l", col=c("cyan3"))
plot(I(v$nr/1e9)~seq(1,200,1), ylab="Recruitment", xlab="Year", type="l", col=c("cyan3"))
plot(v$dr~seq(1,200,1), ylab="actual/potential", xlab="Year", type="l", col=c("cyan3"))

res = simulate(0, 45, F)
matplot(cbind(v$ssb/1e9, res$summaries$SSB[1:200]/1e9), ylab="SSB (MT)", xlab="Year", col=c("cyan3", "black"), lty=1, type=c("p","l"), pch=1)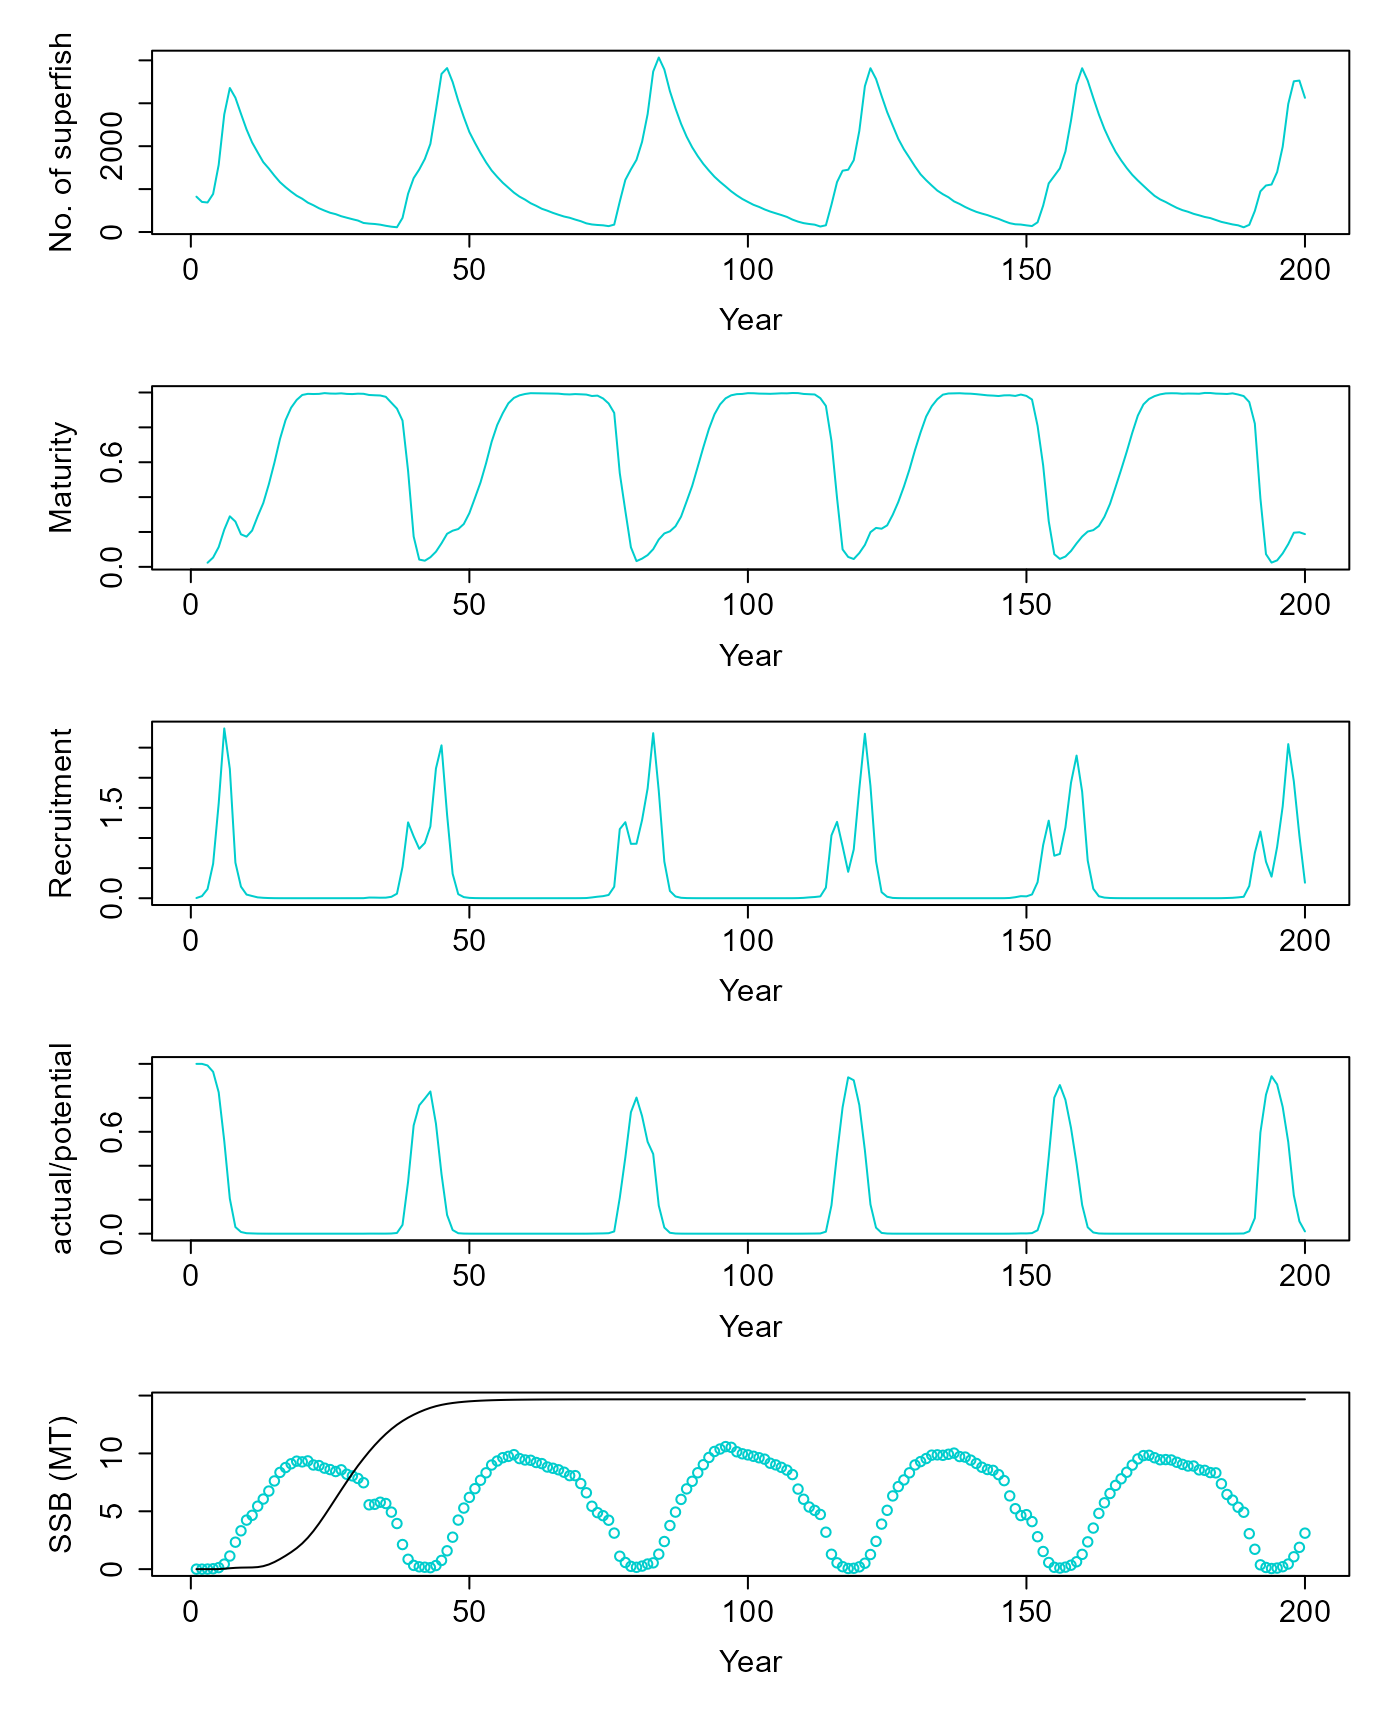
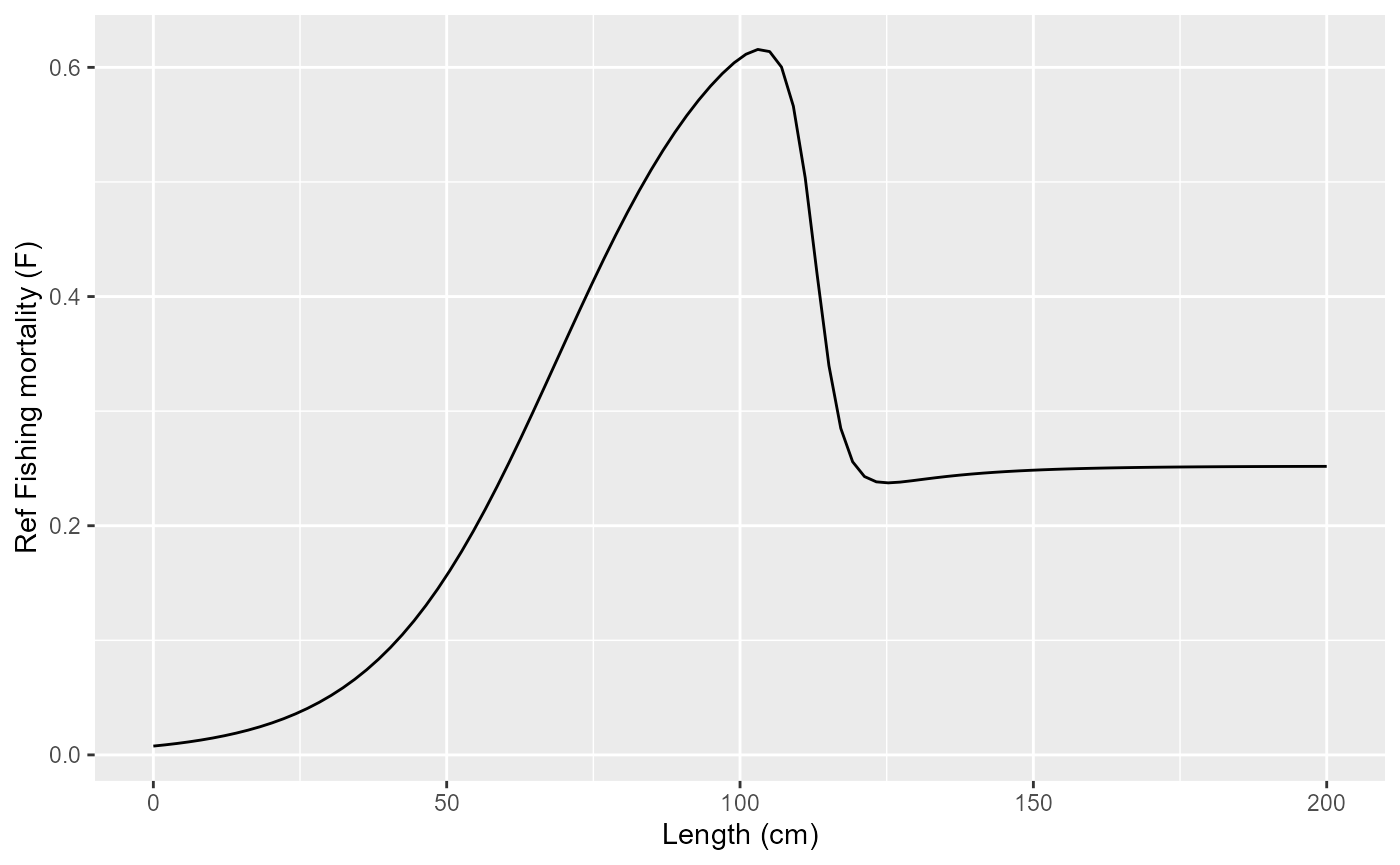
Reference fishing mortality curve
fleet = new(Fleet)
fleet$readParams(params_file_fleet, F)
fleet$par$print()
fleet$par$control_model = "linear"
fleet$chi = 100

print(
tibble(length = seq(0, 200, length.out=100)) |>
  mutate(f = purrr::map_dbl(length, ~fleet$fishingMortalityRef(.))) |>
  ggplot(aes(x=length, y=f)) +
  geom_line() +
  labs(x="Length (cm)", y="Ref Fishing mortality (F)")
)
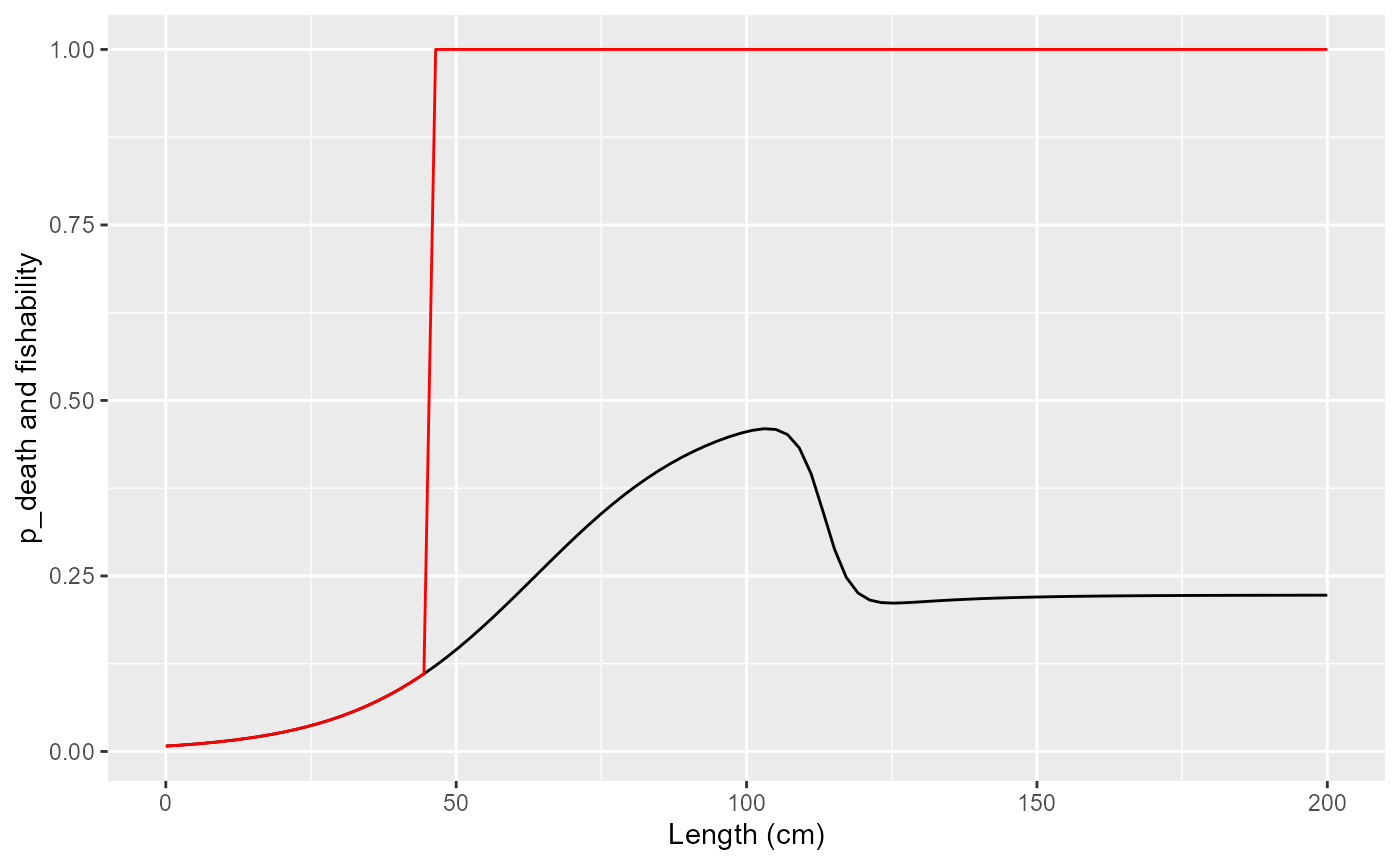
Fishability: values used as weights for computing averages over fishable population
print(
tibble(length = seq(0, 200, length.out=100)) |>
  mutate(
    f = purrr::map_dbl(length, ~fleet$fishingMortalityRef(.)),
    p_death = 1-exp(-f),
    fishability = purrr::map_dbl(length, ~fleet$fishability(.))
    ) |>
  ggplot() +
  geom_line(aes(x=length, y=p_death), col="black") +
  geom_line(aes(x=length, y=fishability), col="red") +
  labs(x="Length (cm)", y="p_death and fishability")
)
get_fishing_mortality = function(length, chi) {
  fleet$chi = chi
  fleet$fishingMortality(length)
}

print(
list(length = seq(0, 200, length.out=200),
     chi = exp(seq(log(0.05), log(2), length.out=20))) |>
     cross_df() |>
  mutate(f = purrr::map2_dbl(length, chi, ~get_fishing_mortality(.x, .y))) |>
  mutate(fref = purrr::map_dbl(length, ~fleet$fishingMortalityRef(.))) |>
  ggplot() +
  geom_line(aes(x=length, y=f, group=chi, col=chi)) +
  geom_line(aes(x=length, y=fref), col="red") +
  labs(x="Length (cm)", y="Ref Fishing mortality (F)")
)
## Warning: `cross_df()` was deprecated in purrr 1.0.0.
## ℹ Please use `tidyr::expand_grid()` instead.
## ℹ See <https://github.com/tidyverse/purrr/issues/768>.
## This warning is displayed once every 8 hours.
## Call `lifecycle::last_lifecycle_warnings()` to see where this warning was
## generated.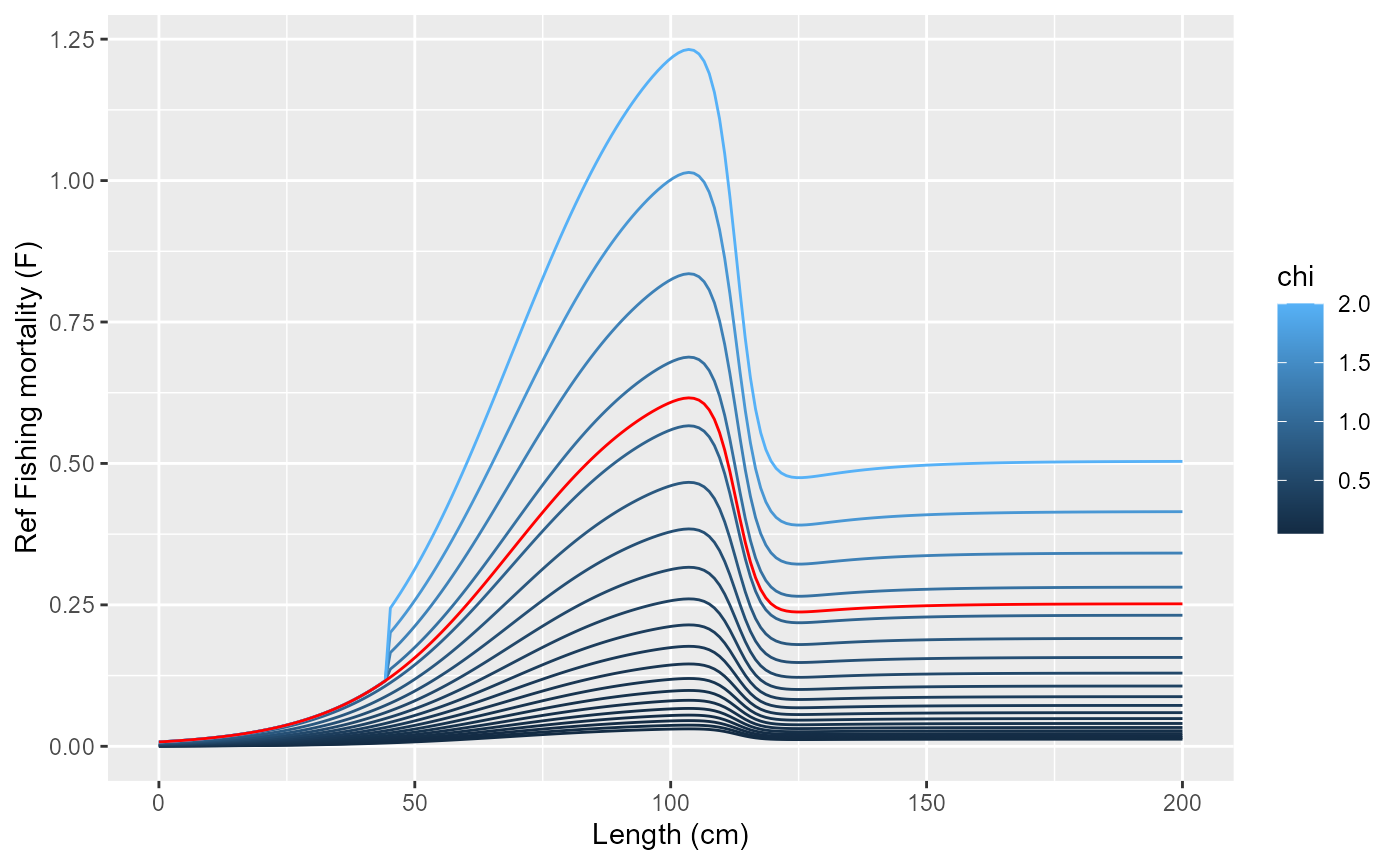
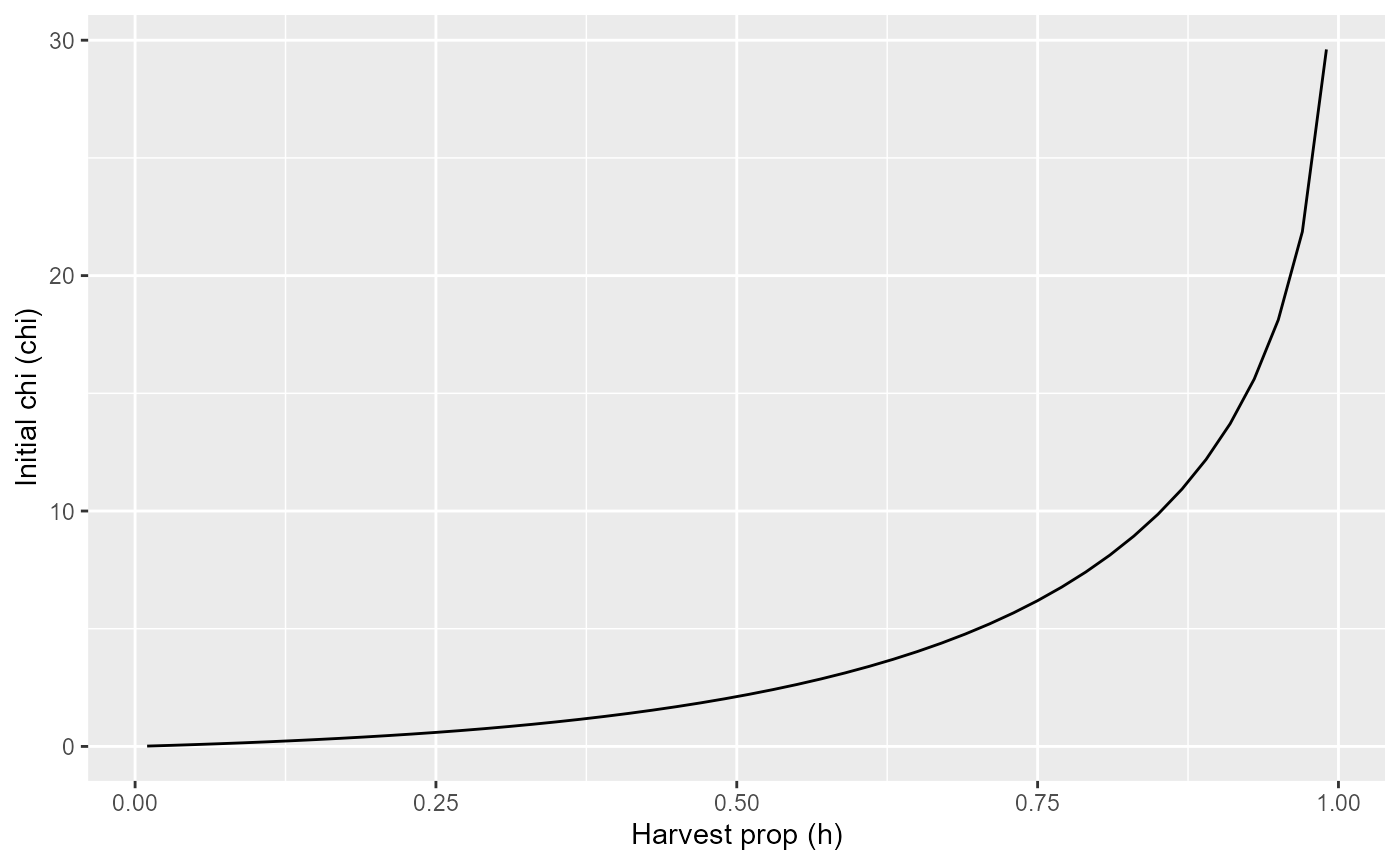
Initial chi
init_chi = function(F_fgf){
  fleet$init_chi(pop, F_fgf, 5.61)
  fleet$chi
}

print(
tibble(h = seq(0.01, 0.99, length.out=50)) |>
  mutate(F_fgf = -log(1-h)) |>
  mutate(chi = purrr::map_dbl(F_fgf, ~init_chi(.))) |>
  ggplot() +
  geom_line(aes(x=h, y=chi)) +
  labs(x="Harvest prop (h)", y="Initial chi (chi)")
)